Using chrome-devtools-mcp for Agent Browser Control
MCP standardizes agent-to-tool communication, eliminating custom connectors for each integration.
The choice of MCP as the interface layer is not incidental, and understanding what problem it actually solved clarifies everything built on top of it.
Anthropic introduced the Model Context Protocol as an open standard in November 2024 to address what they described as an N×M integration problem: every agent connecting to every external tool required its own custom connector. The combinatorial overhead was unsustainable. MCP defines a consistent communication layer so any compliant agent can call any compliant server without bespoke glue code on either side.
The governance trajectory matters more than the technical spec. In December 2025, Anthropic donated MCP to the Agentic AI Foundation (AAIF), a Linux Foundation directed fund co-founded by Anthropic, Block, and OpenAI. When three major players jointly steward a standard through an established open-source foundation, you are looking at infrastructure, not a proprietary API with an uncertain roadmap. The MCP Dev Summit North America in April 2026 drew approximately 1,200 attendees. Salesforce's Headless 360 platform reported 4.5 million MCP calls processed in roughly its first month. Adoption at the tooling layer is not speculative.
For the browser case specifically, MCP's value is interoperability. The Chrome DevTools integration does not require a Cursor plugin, a Claude extension, or a Copilot-specific SDK. Any MCP-compliant host gets the same interface. The protocol absorbs translation work that would otherwise fall to each client maintainer individually, precisely the kind of diffuse, invisible tax that accumulates until it collapses a promising ecosystem.
How chrome-devtools-mcp connects an agent to a live browser session
Provenance matters here: chrome-devtools-mcp was built and is maintained by the official Google Chrome DevTools team. This is not a community wrapper that reverse-engineered a Chrome API. It is a first-party implementation from the team that also maintains DevTools itself, a distinction with real consequences for correctness and long-term maintenance alignment.
The architecture moves through three layers. The agent issues a high-level MCP tool call, something like navigatepage or listconsole_messages. The MCP server translates that call into Chrome DevTools Protocol actions via Puppeteer. Results return as structured JSON the agent can parse and act on. No screen-scraping, no pixel inference, no coordinate guessing.
Puppeteer's role as intermediary deserves more than a footnote. Raw CDP is powerful but demanding: timing, page-load detection, DOM-readiness checks, and network-idle detection all require explicit handling. Puppeteer manages those details automatically, which means the agent's instructions execute with the robustness of a hand-written Puppeteer script without requiring the agent to reason about browser timing states. In an agentic context, a race condition produces a wrong tool result, which produces a wrong diagnosis, which produces a wrong fix. That failure chain compounds quietly and, in practice, it does so faster than most developers expect the first time they encounter it.
Two connection modes are available. Automatic connection, available for Chrome 144 and later, lets the agent attach to a running Chrome instance, useful when the developer wants to share the same session they are already browsing in. Manual connection via the remote debugging port suits CI environments or sandboxed instances where a headless browser with no stored credentials is preferred. Chrome 146 is adding a native settings toggle to eliminate the command-line flag requirement entirely, which will matter for teams that enforce controlled Chrome deployments.
Supported clients span the field: Gemini CLI, Claude Code, Cursor, Copilot, JetBrains Junie, and anything else that speaks MCP. The public preview launched September 23, 2025, at version 1.6.0 on npm.
The 26 tools the agent actually gets — and what each category enables
Twenty-six tools across six functional categories. The number alone invites dismissal as a kitchen-sink API; the categorization tells a more coherent story about what problems the tool was actually designed for.
Input automation covers clicking, dragging, filling fields, handling dialogs, and uploading files. This is the full interaction surface of a form or UI flow, addressable without a human hand-off at any step.
Navigation tools include navigatepage, newpage, listpages, selectpage, closepage, navigatepagehistory, and waitfor. The agent can manage a multi-tab session, not just a single URL. For anything beyond a single-page interaction, that distinction separates a useful tool from a toy.
DOM inspection and JavaScript execution give the agent direct access to live page structure and runtime state, not a static snapshot rendered at build time but the actual DOM as it exists in memory when the agent queries it.
Network analysis captures requests and responses as they happen. The agent can identify failed API calls, unexpected payloads, CORS errors, and missing headers without a human opening the Network panel and reading it aloud. That single capability eliminates a category of debugging relay that accounts for a substantial fraction of agent-human back-and-forth in current development workflows. It also raises a question that I find worth sitting with: how much of what we call "human oversight" in browser debugging is actually compensating for the agent's inability to read what the browser is already reporting?
Performance profiling exposes Core Web Vitals (LCP, INP, CLS) and full performance traces. The agent can quantify regressions it introduced, not just observe that something feels slow.
Lighthouse audits generate structured accessibility, SEO, and best-practice reports programmatically. The agent gets a score to optimize against.
Screenshots provide visual capture at any point in a workflow, useful both as a verification mechanism and as a record the agent can pass to a human reviewer when a judgment call requires human eyes.
Three limitations deserve plain statement. chrome-devtools-mcp supports Chrome and Chromium only; Firefox, Safari, and WebKit are out of scope. Complex multi-step end-to-end automation workflows at production scale are explicitly outside its design target. File download management is also unsupported. Knowing a tool's edges is as important as knowing its capabilities.
The closed debugging loop this enables in practice
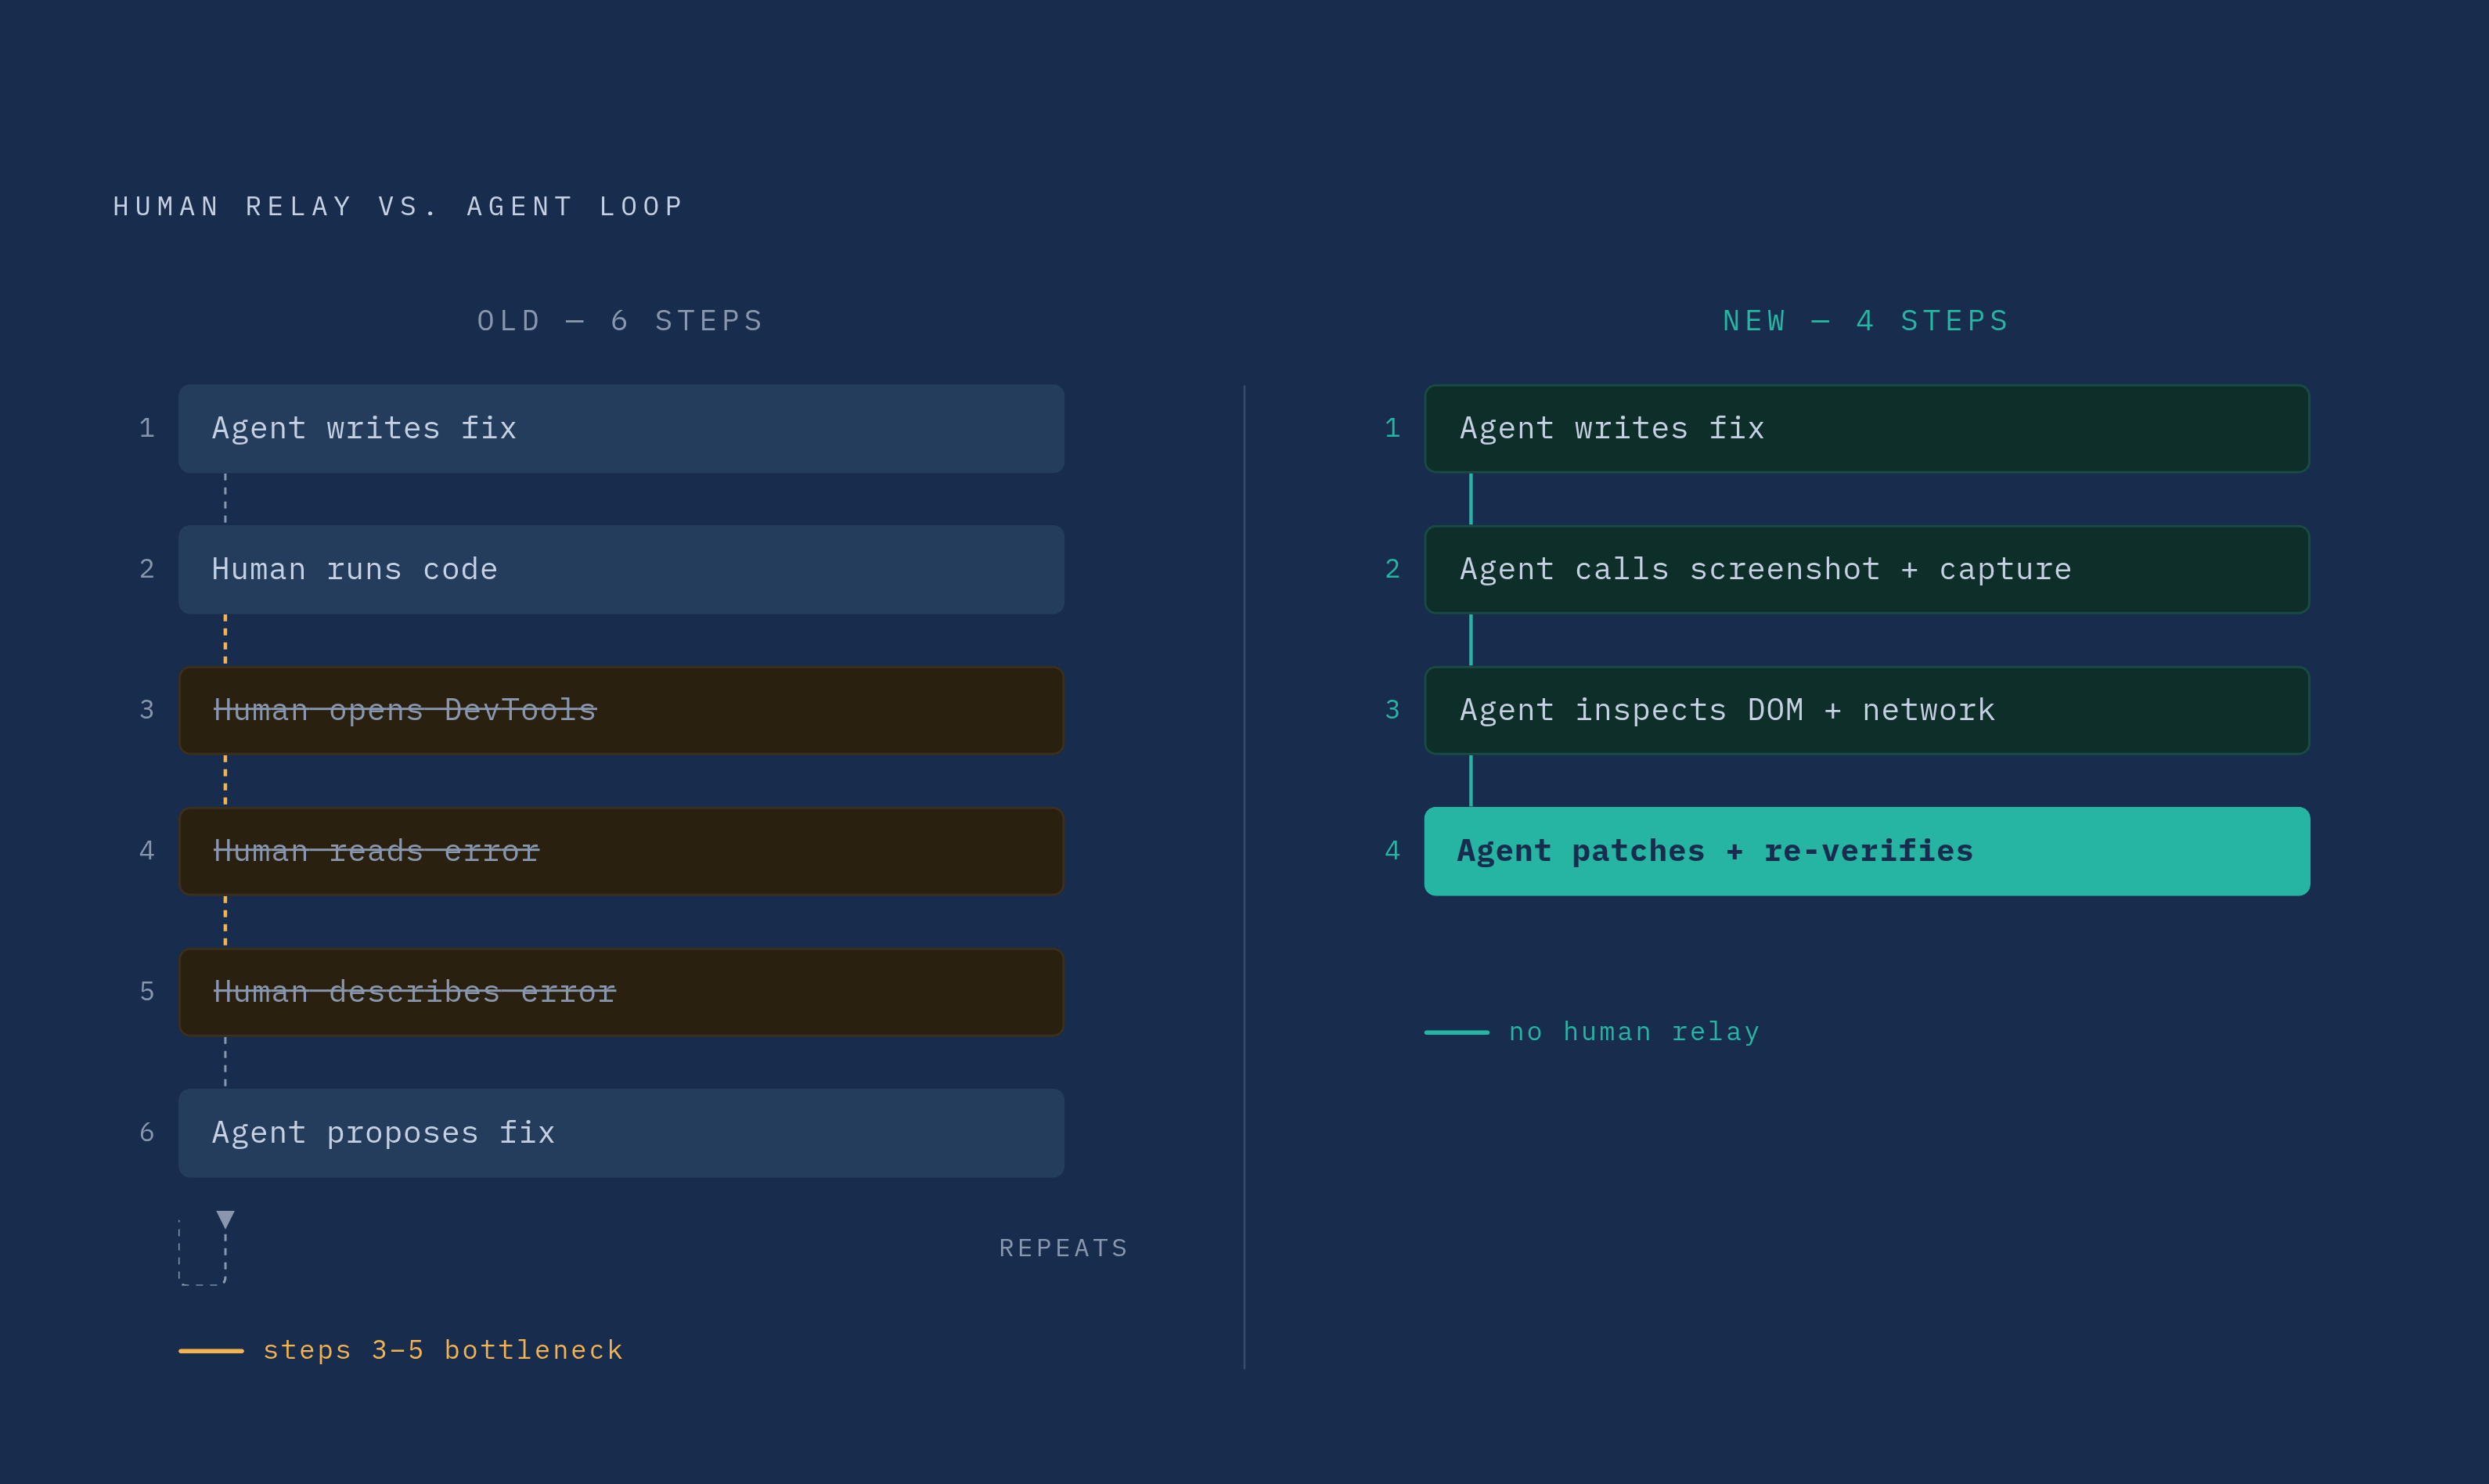
The pre-existing loop is familiar to anyone who has worked with coding agents for more than a few weeks. The agent writes a fix, the human runs the code, the human opens DevTools, the human reads the error, the human describes the error back to the agent in a new message, the agent proposes another fix. Each iteration requires a context switch that breaks the automation premise. The agent is fast; the human relay is the bottleneck.
The Chrome DevTools team describes the intended replacement explicitly: generate a fix with your AI agent, then automatically verify that the solution works as intended. Verification moves inside the agent's own context.
A layout regression illustrates the mechanics. The agent ships a CSS change, calls for a screenshot and a CLS measurement. The score reveals a shift exceeding the acceptable threshold. The agent inspects the DOM, identifies an unsized image as the cause, adds explicit dimensions, re-runs the Lighthouse audit, and confirms the score improved. No human relay required at any step. A failed API call follows similar logic: the agent navigates to the page, reads the network capture, identifies a 401 on a fetch request, traces it to a missing Authorization header in the code it generated, patches the header, and re-verifies the network response.
The velocity implication is direct. Each iteration that previously required human context-switching now completes within a single agent session. The bottleneck shifts from "can the agent fix it" to "how fast can the browser confirm it," which is a tractable constraint of an entirely different kind. Whether that shift feels significant depends heavily on how many iteration cycles your current workflow actually burns through before a fix lands clean.
Where chrome-devtools-mcp fits relative to other agent browser approaches
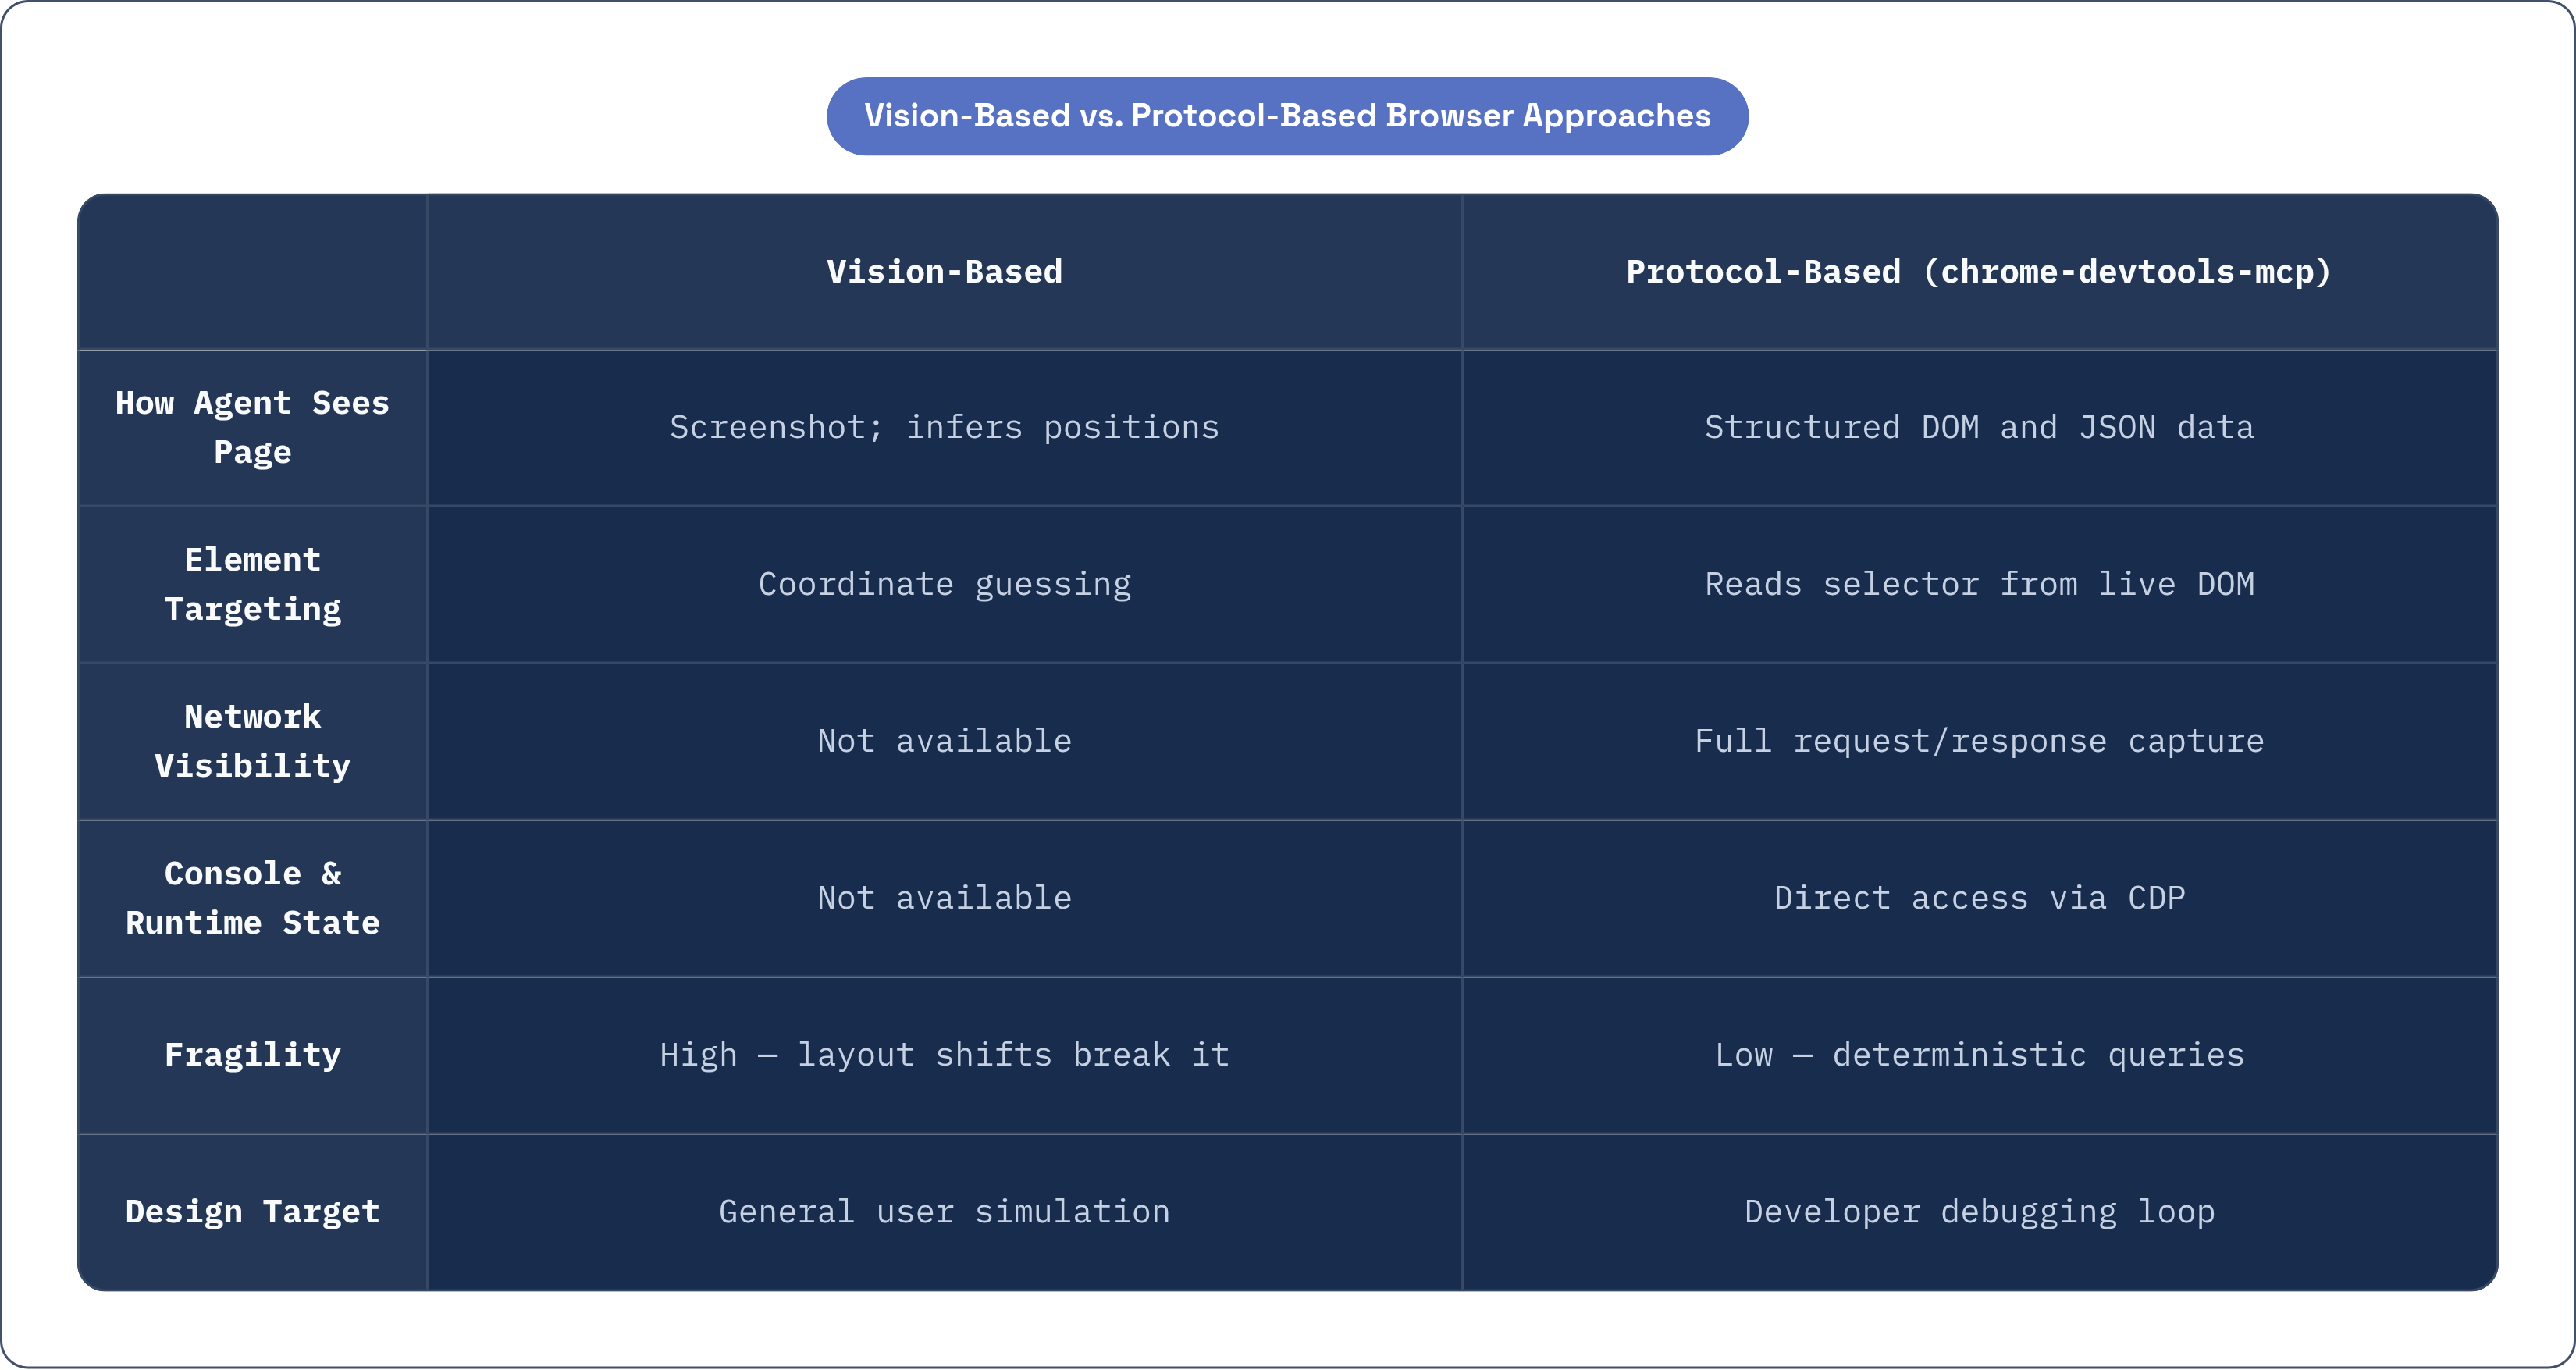
Two paradigms dominate the space for giving agents browser access. Vision-based approaches feed the agent a screenshot, let it infer element positions, and click by coordinate. Protocol-based approaches deliver structured DOM, network events, and console data as JSON.
Vision-based approaches have intuitive appeal: they mirror how a human user sees the page. They are also brittle. Layout changes, responsive breakpoints, and dynamic content can shift coordinates enough to break interactions. More critically, a screenshot cannot tell an agent what the console logged, what the network returned, or what the runtime performance profile looks like. The visual representation of a page and the operational state of that page are the same thing only in appearance.
Protocol-based approaches deliver deterministic, queryable data. The agent does not infer that a button exists; it reads that a button element with a specific selector exists in the DOM. The agent does not guess that a network call failed; it reads the status code.
browser-use, one of the more prominent tools in this space, began as a Playwright-based project and migrated to raw CDP in 2025 for performance reasons. Its design target is end-to-end web automation at scale. chrome-devtools-mcp's design target is different: the developer debugging loop, operating within an IDE agent workflow. These are related but distinct problems, and a tool optimized for scraping and multi-step user-simulation is not necessarily optimized for rapid, inspection-heavy iteration during active development.
The first-party authorship advantage bears on this comparison directly. chrome-devtools-mcp exposes the same CDP surface that DevTools uses internally. It is not a wrapper built on a wrapper; it is a first-party interface from the team that maintains both the protocol and the tooling. For correctness and long-term maintenance alignment, that lineage is a structural advantage, not a marketing point.
Getting started: installation, configuration, and the first agent connection
The package is chrome-devtools-mcp on npm, current stable version 1.6.0. Prerequisites are Node.js, a Chrome or Chromium installation, and an MCP-compatible client.
Installation follows the JSON configuration structure MCP standardizes across clients. The exact path to that configuration varies: Cursor has its own MCP settings location, JetBrains Junie uses Settings → Tools → Junie → MCP Settings, Claude Code and Gemini CLI have their own entry points. The underlying configuration block is structurally consistent across all of them.
The connection mode decision comes first. Developing locally and want the agent to see the same browser session you are working in? Automatic connection on Chrome 144 or later is the path of least friction. Setting up for CI or a sandboxed instance with no stored credentials? Launch Chrome with --remote-debugging-port and connect manually. Chrome 146 will replace the command-line flag with a native settings toggle, which is worth knowing if you are configuring this now and expect to revisit the setup when that version ships.
The fastest first verification is a single tool call: instruct the agent to call list_pages. If it returns the open tabs, the connection is live and all 26 tools are active. From there, the most immediately demonstrative exercise is navigating to a page with a known console error, asking the agent to read the console, identify the error, and propose a fix. That loop, runnable in minutes, demonstrates the core value more clearly than any architectural description.
Security considerations that apply when a remote debugging port is open
The Chrome DevTools team is direct about the access scope: once connected, an agent can read, inspect, debug, and modify any data in the browser or DevTools. That includes authenticated sessions, cookies, and all page content. This is not a limitation of the implementation; it is the nature of DevTools access.
The port risk is specific. Any process that can reach the open remote debugging port has full control over that Chrome instance: reading cookies, capturing page content, executing arbitrary JavaScript. The authorized agent is not the only process capable of connecting.
Several mitigations are practical and non-negotiable. Bind the debugging port to localhost only; do not expose it on a network interface accessible externally. Use a dedicated browser profile for agent sessions, entirely separate from the profile holding active authenticated sessions for banking, email, or internal tooling. Treat the debugging port like an open terminal: close it when the agent session ends.
In CI and sandboxed environments, manual connection mode with a headless browser instance is preferable for a structural reason: a headless browser spun up for the agent session has no stored credentials to expose.
A subtler risk deserves naming. Because the agent reads live page content, a malicious page can embed instructions in the DOM designed to redirect the agent's actions. This prompt injection vector is documented, not theoretical, and it applies to any workflow where an agent processes externally sourced content. The agent browsing an internal staging environment carries a different risk profile than the agent browsing arbitrary external pages. Careful scoping makes this manageable in principle, but how confident can you be in that scoping when the agent is, by design, navigating pages to read their content? That is a question each team has to answer honestly before expanding scope.
As organizations scale beyond a single MCP server, ad-hoc per-server security configuration becomes a liability. For teams moving chrome-devtools-mcp from a local developer tool into a shared or production-adjacent workflow, centralized governance over MCP tool calls, with user-level controls and audit trails, is worth evaluating before you need to retrofit it.
Where this fits in the broader shift toward agents that close their own feedback loops
Per LangChain's State of Agent Engineering survey, conducted with 1,340 respondents in late 2025, 57.3% of respondents have agents running in production. Quality is the top barrier to broader deployment, cited by 32%. Quality in the browser context is precisely what chrome-devtools-mcp addresses: not whether the code compiles, but whether it behaves correctly under real runtime conditions.
The same survey found that 89% of respondents have implemented agent observability. That near-consensus reflects a practical recognition that agents need monitoring infrastructure, not because developers distrust them, but because unobserved systems fail in undetected ways. Browser-side feedback during development is the same instinct applied earlier in the lifecycle.
A persistent gap separates enterprise AI ambition from operational reality. A large majority of enterprises report AI agent adoption, but a small fraction run agents in production. The distance between "we have agents" and "agents are doing real work" is, in substantial part, a verification and tooling problem. Agents that cannot confirm their own outputs require human verification at every step, which undermines the efficiency premise that justified adopting them in the first place.
chrome-devtools-mcp points toward a different model: agents that do not just generate but validate, that treat browser confirmation as part of the task definition rather than a QA step delegated downstream. That reframing is not yet the default, and getting there is harder than installing a package.
What remains unsolved is concrete. The Chrome-only constraint means an agent cannot confirm behavior in Safari or Firefox, which matters for any project with cross-browser requirements. Complex multi-step automation at scale is explicitly outside the tool's design scope. And as agent sessions multiply across teams, the governance overhead of managing MCP server access scales in ways that point-solution configuration does not handle.
Version 1.6.0, a modest npm footprint, less than a year in public preview. The tool is early. The architectural argument it makes, that protocol-native browser access through a standardized agent interface is the correct pattern, is gaining traction for reasons that hold up under scrutiny. Whether chrome-devtools-mcp specifically carries that argument forward at scale is still an open question. The gaps are real, and the teams that run into them first will have the most useful things to say about what comes next.